Debugging
You have a website, some data, templates, and you're not writing PHP anywhere. How on earth do you look under the hood? Know when something is broken? Fine-tune performance? Excellent question. Here come the answers.
Debug Mode
Enabling Debug Mode in System » Settings » Debugging in the control panel, or with debug: true in site/settings/debug.yaml, will render any errors and exceptions to the browser will a full stack trace. Some of the messages are really clear and helpful, like Can't write such and such file or folder, but others are a bit more cryptic.
Debugging is visible to everyone. Think hard before enabling any form of it on a live site.
Logging
Things go wrong. It’s a part of life. Fortunately, we can see what went south using logs. There are a number of different logging methods available to you in Statamic.
Statamic comes pre-configured with error logging provided by Laravel and the powerful Monolog logging library. This allows you to use a number of logging handlers, should you wish to integrate with something more advanced.
Configuring Handlers
Your logging configuration can be edited in the Debug settings section of the CP, or by editing the loggers key in debug.yaml.
You may configure multiple handlers at the same time by adding each one with their separate key.
loggers:
  file: true
  slack:
    token: ...
All handlers accept a level key, where you can specify the minimum severity level that should be logged for that handler. Here they are, from least to most severe: debug, info, notice, warning, error, critical, alert, emergency.
File
Out of the box, Statamic uses the file log handler. This will write to local/storage/logs/statamic.log.
You may customize the location of your log file by adding a path to the directory of your choice.
loggers:
  file:
    path: /home/logs
If you find your log file growing too large, you can enable daily files. This will create files
with datestamps. To do that, simply add daily: true to your file logger config.
loggers:
  file:
    daily: true
By default, it logs debug severity and up.
Browser
Logs directly to your browser’s console.
loggers:
  browser: true
By default, it logs debug severity and up.
Sends an email using PHP’s mail() function.
loggers:
  email:
    to: you@example.com
    from: me@example.com
    subject: An error has occurred
By default, it logs error severity and up.
Hipchat
Sends logs to a Hipchat room.
loggers:
  hipchat:
    token:
    room:
    name:
By default, it logs critical severity and up.
Slack
Sends logs to a Slack channel.
loggers:
  slack:
    username: The user that will post the logs (might want a new one)
    channel: This should be surround by quotes and include the hash, i.e. `"#myloggingchannel"`
    token: Go to https://api.slack.com/docs/oauth-test-tokens (making sure you are logged in) and create one for your logging user
    icon_emoji: This is optional
By default, it logs critical severity and up.
Fleep
Sends logs to Fleep.io
loggers:
  fleep:
    token:
By default, it logs error severity and up.
Flowdock
Sends logs to Flowdock.
loggers:
  flowdock:
    token:
By default, it logs critical severity and up.
Syslog
Sends logs to your system log.
loggers:
  syslog:
    identity: Statamic
By default, it logs error severity and up.
Triggering Logs
Within code, you may trigger a log to be written (or sent, etc) by using Laravel’s Log facade.
The logger provides the eight logging levels defined in RFC 5424: emergency, alert, critical, error, warning, notice, info and debug.
Log::emergency($error);
Log::alert($error);
Log::critical($error);
Log::error($error);
Log::warning($error);
Log::notice($error);
Log::info($error);
Log::debug($error);
An array of contextual data may also be passed to the log methods. This contextual data will be formatted and displayed with the log message:
Log::info('User failed to login.', ['id' => $user->id]);
As the facade belongs to the global namespace, remember to either use Log once, or do \Log::info().
The Debug Bar
The Debug Bar has a whole pile of useful information just waiting for you. Enable it in System » Settings » Debugging in the control panel, or with debug_bar: true in site/settings/debug.yaml.
Once enabled, the Debug Bar will present itself to you on the front-end of your site, fixed to the bottom of the browser. It has a number of tabs, each with its own purpose, as well as some data about your environment.
Messages Tab
A generic catch-all for anything might dump data into the Debug Bar like a pile of garbage. The dump modifier, for example.
Timeline Tab
Shows you various server side processes and how long each took to render the page. Template parsing, tag rendering, and routing, for example.
Exceptions Tab
Displays any caught and suppressed Exceptions.
Events Tab
Events are any system Events that were triggered during the loading of any given page request. Each Event can have listeners attached (in an Addon, for example) and corresponding actions run. It’s just nice to know what’s firing when.
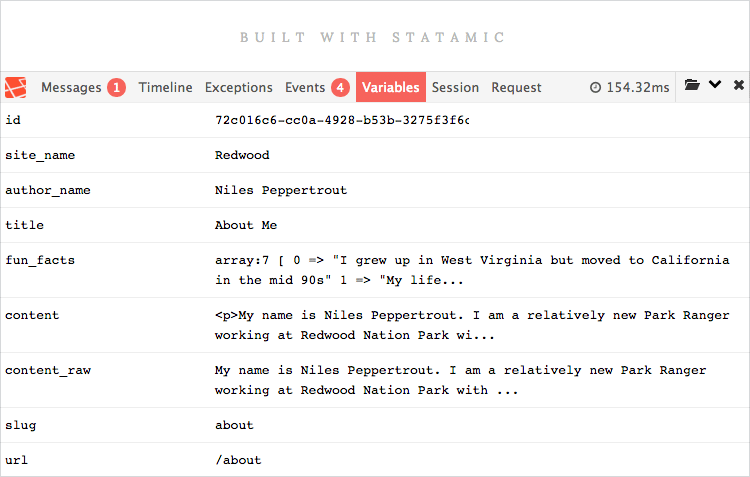
Variables Tab
Shows you all the data readily available to the page without needing to use Tags. Page data, global variables, system settings, and more are all available in their pre-rendered data types allowing you to see Carbon objects, datestamps, scopes, and other interesting things.
Sessions Tab
Any session variables, flash data, and previous URL visited is shown here.
Request Tab
Information about the given page request is here, from content_type and status_code to any POST data and session attributes. Very handy.
Utility Modifiers
There are a few utility modifiers that let you debug data without the need for the Debug Bar. Check these bad boys out: